Most people probably have some experience working with high-altitude photography, although familiar formats like "Google Earth" often blur[^1] aerial imagery with satellite imagery. Some people may associate the term with sophisticated surveillance/reconnaissance systems, while others may associate it with astronomy. An expert in the field will tell you that it's used in nearly every discipline.[^2] There are a lot of different branches to this: high-altitude imagery can come from a variety of platforms, be constructed from a variety of means, and be used for a wide array of purposes. You can use such imagery to track the progression of disease through a region, monitor water table levels, detect footprints in the snow, or predict supermarket earnings. With such a broad topic, I would usually prefer to start from a high-level view, but in this case higher-level views equate to more recent advancements and it's never a good idea to start recent. So, in light of all of this, I'll be starting with balloons.
[^1]: The word "blur" here is a little bit too close for comfort to what Google Earth actually does. It was meant to be figurative.
[^2]: Don't worry, you'll know if you meet one.
Brief History of Aerial Photography
Chemical Photography
The camera was invented in 1816 by Nicéphore Niépce, but this first iteration was quite a fickle device. It consisted of an enclosed box with a single lens through which light could pass. This projected an inverted image onto the side of the box opposite the lens when the box was placed in a well-lit environment. If you placed a paper coated with silver chloride (a light-sensitive chemical) in the box then the portions of the paper that were brightly lit would cause the chemical to darken, while unlit portions would not. The result was an image inverted in both dimension and color (a negative). There was no mechanism at the time to prevent the chemical from continuing to react after exposure, so the box had to be sealed until the photograph could be inspected in a dark room. The photograph would quickly degrade whenever it was exposed to light. By 1826, he had modified the process to produce more stable photographs by switching to a pewter plate coated in a compound of light-sensitive tar called Bitumen of Judea, dissolved in lavender oil. When exposed to light, the Bitumen hardens and bonds to the pewter plate, so after a lengthy exposure in the camera apparatus (upwards of 8 hours) the portions of the plate exposed to bright light were bonded to the tar and the rest of the compound could be washed off in a dark room after the exposure is over. Once this was complete, the image could be brought into the light without being destroyed.
It wasn't until 1839 that the exposure time was drastically reduced when Louis Daguerre introduced the novel daguerreotype process. His process used a sheet of copper plated with a polished mirror-like silver which was then exposed to iodine vapor, resulting in a light-sensitive silver iodide coating. This chemical had an interesting property of producing a "latent image" when exposed to light for just a few minutes: the image doesn't form upon exposure to light, but the material undergoes a chemical reaction which is invisible to the naked eye. Treating the exposed image with heated mercury vapor causes the mercury to bond to the portions that had been exposed to light, producing a crisp image. The unexposed silver iodide could then be washed off in a salt water solution so it would no longer be sensitive to light after development. This process basically set off the commercial photography industry, leaving it with a very alarming new ingredient: heated mercury vapor.
Balloons, Pigeons, and Airplanes
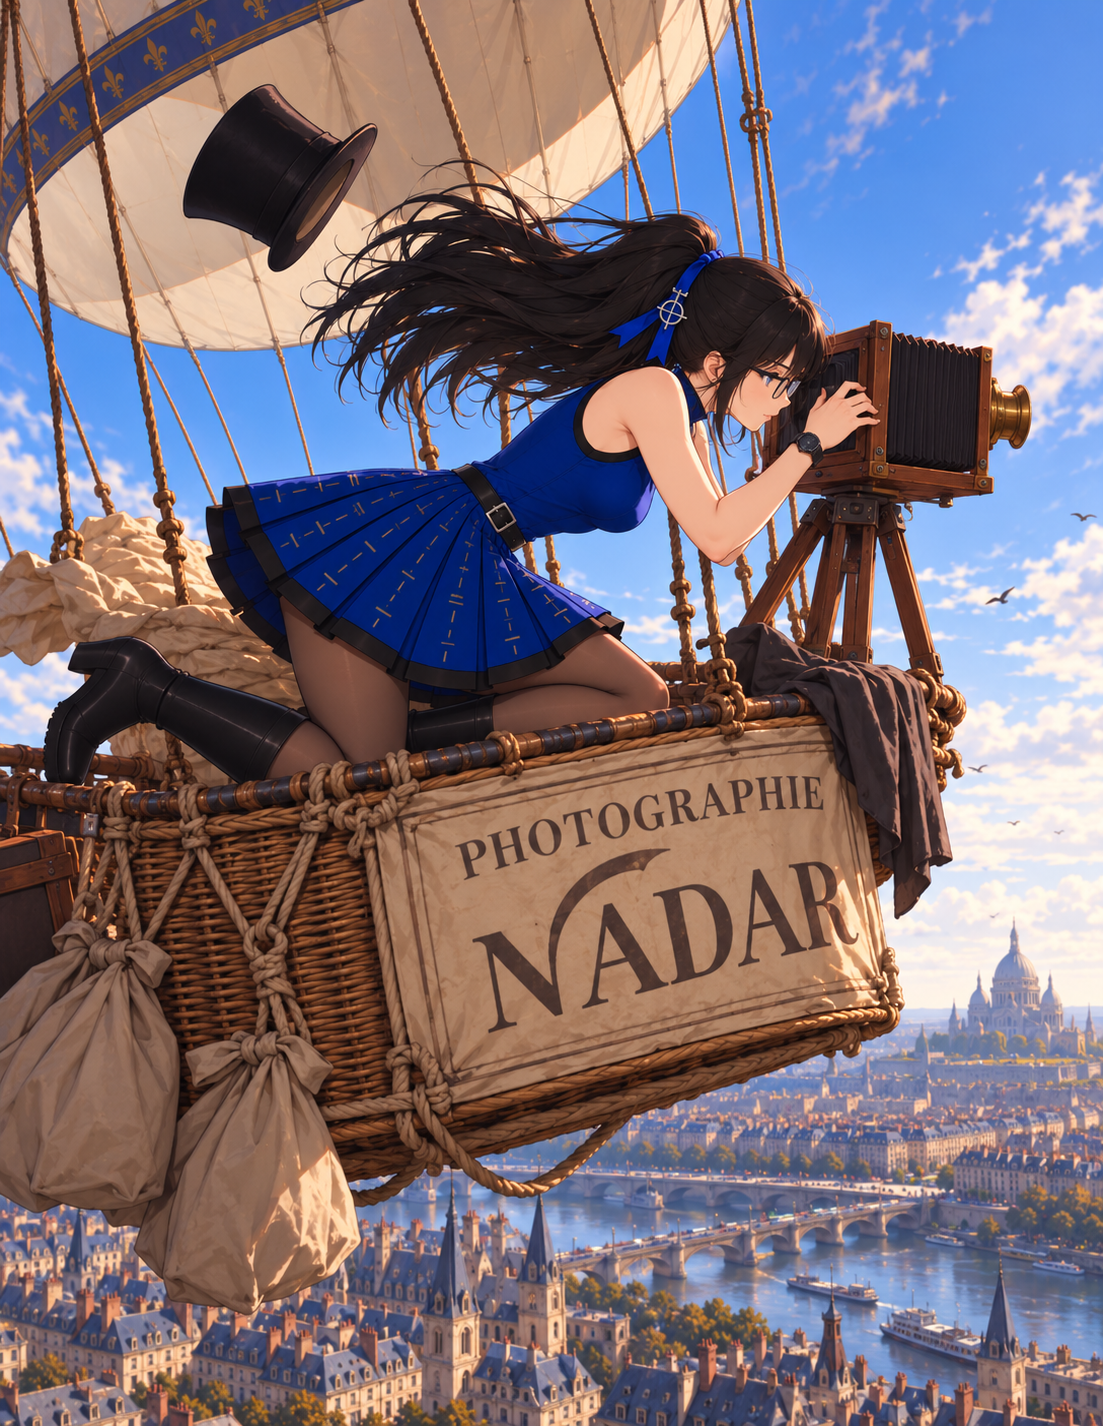
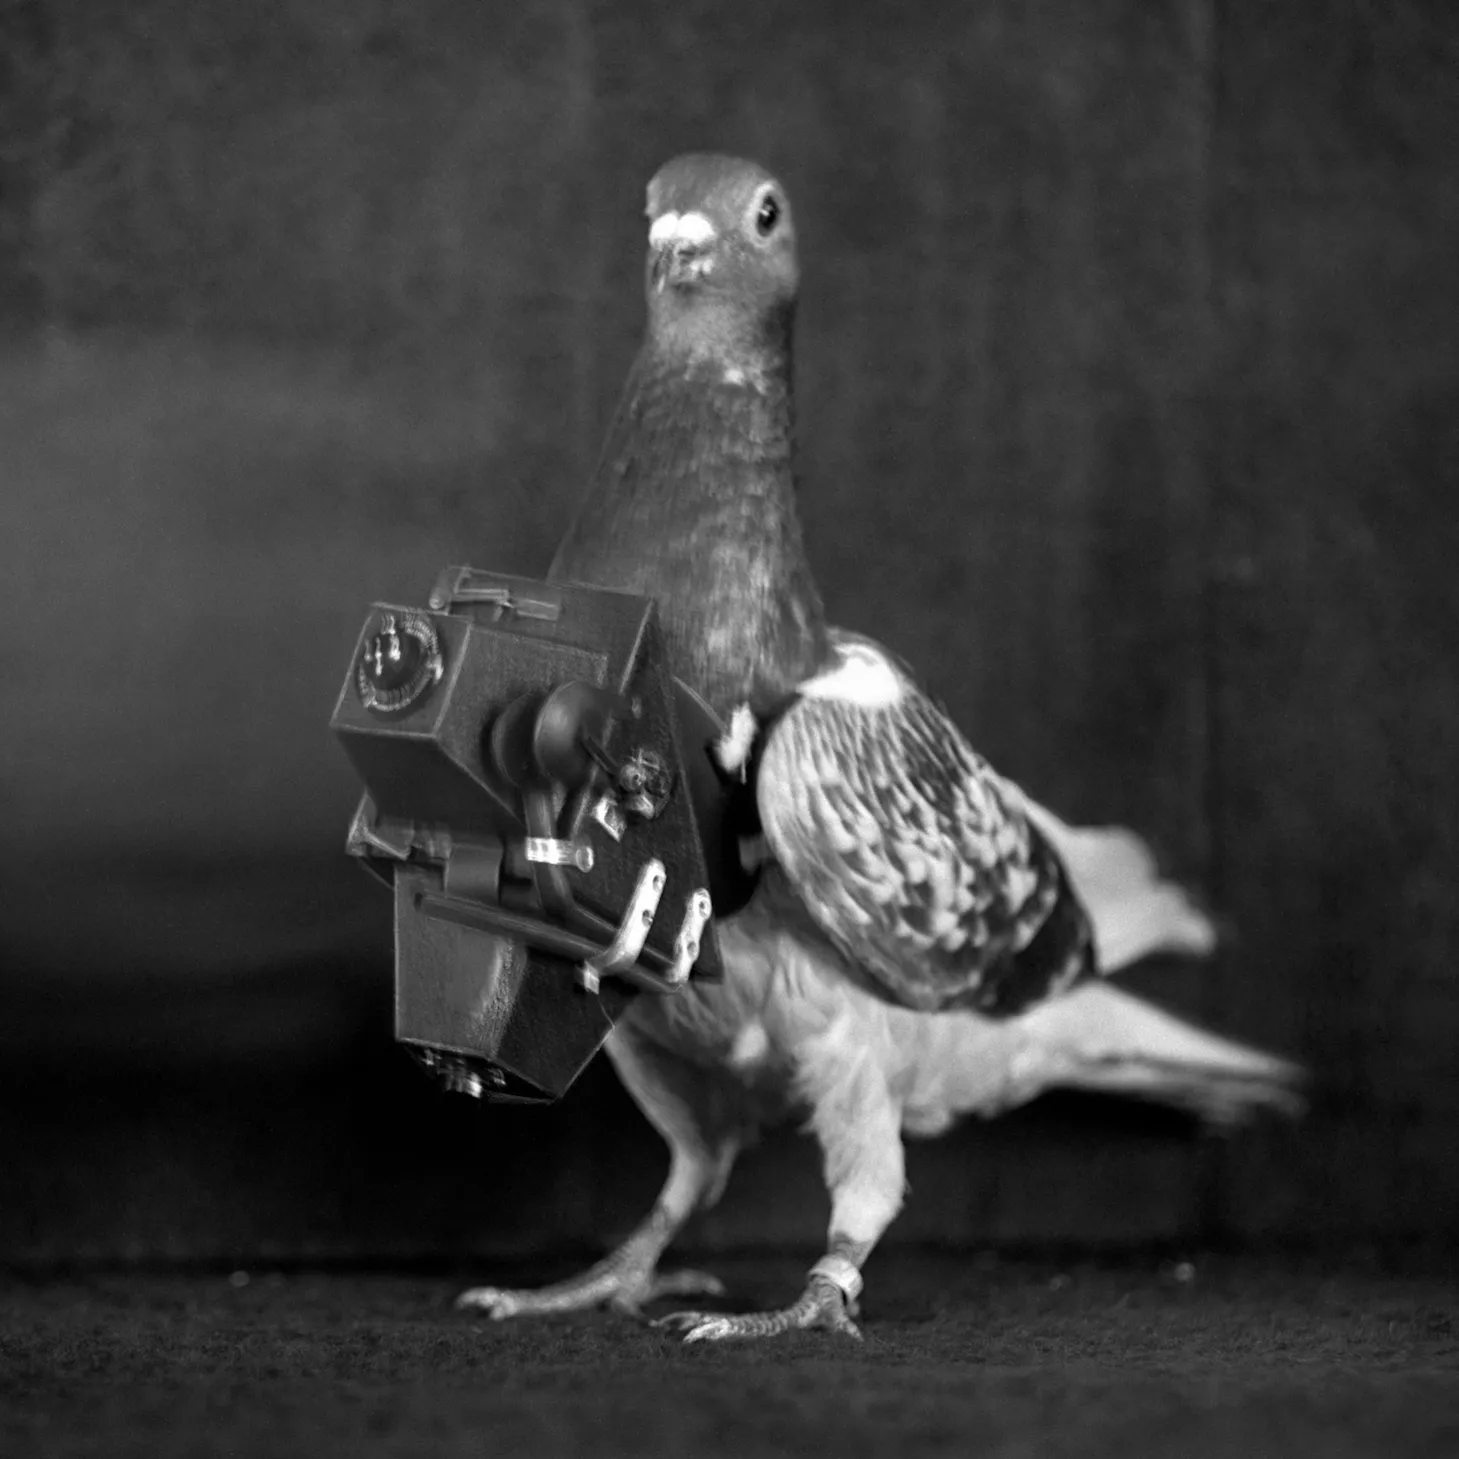
Knowing this, it may surprise you to discover that it took a whole 19 years before someone (Gaspard-Félix Tournachon, known as "Nadar") thought to bring one on a balloon.[^3] Unfortunately that image no longer exists, but we do have one from 1860 capturing a view of Boston at 1,200 ft. After that came color film, the chemistry of which is outside the scope of this article, followed by the idea of using kites for aerial photography. From there it was only a matter of time before cameras got small enough to strap to carrier pigeons, and that was basically the peak of the discipline. It all went downhill from there.
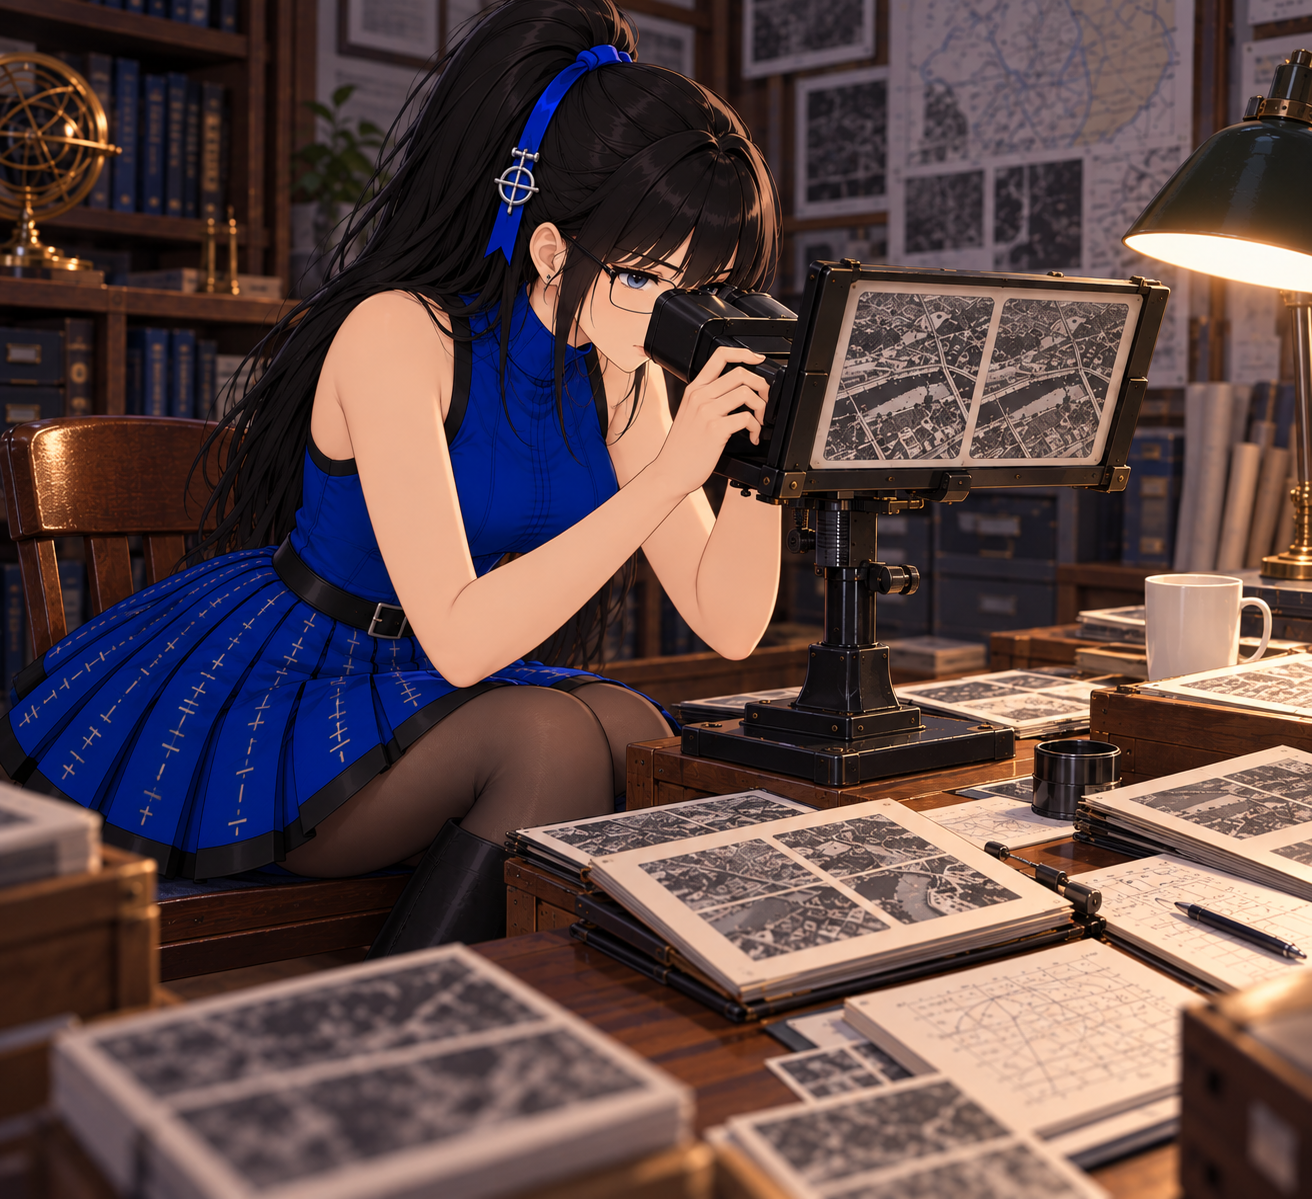
At some point people started putting cameras on airplanes. Wilbur Wright, known for his early investment in the aerospace industry, was unsurprisingly a proponent of this "advancement".[^4] This was the "Wright Military Flier", made just six years after the first Wright Flier. It was a two-seater biplane with a four-cylinder engine which could fly at a maximum airspeed of approximately 40 mph, could stay in the air for a little over an hour, and was initially sold to the US Army Signal Corps for $30,000. Wilbur was heavily involved in marketing this airplane in Europe, specifically to the Kingdom of Italy which at the time was heavily investing in military technology in preparation for an upcoming conflict in Europe. During this time aerial photography began being used in increasingly sophisticated ways that started to resemble photogrammetry. 1912 is the first recorded instance of using overlapping vertical aerial photographs in a stereoscope[^5] to visualize topography.
Shortly afterward, the aforementioned upcoming conflict came and notably was not confined to Europe. Throughout World War 1, aircraft were increasingly used to provide photographic reconnaissance by several of the belligerents, including the use of downward-facing mounted cameras that took overlapping photographs which could be stitched together into large, cohesive maps.
After the war, the field continued to advance. More sophisticated photography and photogrammetry equipment was developed, hyperspectral imaging came about, and the discipline underwent the digital revolution. Before we get into all of that, the post World War 1 era brought another noteworthy change:
[^3]: Okay, I admit there were a few technological hurdles that had to be overcome. Nadar basically had to fit a whole photographic development studio in the balloon with him. Balloons at that time also used hydrogen, so that combined with mercury vapor gets us pretty close to a "fire diamond" bingo. I'm sure the whole ordeal was quite impressive, it just doesn't seem like it was as high a priority as it could have been.
[^4]: Sure, airplanes are useful. But just look at what the Wright brothers took from us. Cinematic scenes of photographers riding balloons and those little pigeon cameras. They didn't take passenger pigeons from us though, someone else did that.
[^5]: This is basically an early form of 3D glasses, but photogrammetrists don't like to hear that.
The Introduction of Radar
Radar Overview
Radar is a conceptually simple topic which actually has a lot of complexity in practice. In concept, it's a device which transmits a pulse of radio energy out into the world and waits to receive echoes of the pulse. The time between transmission and reception of an echo can be used to approximate the distance to its source. If the transmitter and/or receiver uses a directional antenna, you can infer the direction of the echo from where the antenna was pointed when it was received. In practice, this is very complicated to do for several reasons:
- For long range radars, you need the pulse to be very powerful. The received power of the echo falls roughly with the fourth power of range and depending on the size and material of the target, a very small portion of the incident power will be echoed back. It's common for a radar transmitter to operate at a power on the order of megawatts while the receiver must be sensitive to echoes on the order of picowatts.
- Depending on the radio frequency used it can be quite technically difficult to even generate a short pulse with enough power. While some radars operate at relatively low or extremely high frequencies, it's common for radars to use frequencies in the range of 3-10 GHz. Generating the required power at the upper end of that frequency range is technically difficult with conventional transistor-based amplifiers, so even modern radar technology frequently features specialized vacuum-tube based amplifiers such as magnetrons, gyrotrons, travelling-wave tubes, cross-field amplifiers, and klystrons.[^6]
- A single-frequency pulse often isn't good enough since it's difficult to distinguish a low-power single-frequency echo from noise, so modern radars often have complex waveforms which are even more difficult to generate with analog amplifiers.
- The targets of interest aren't the only echoes coming from the environment. The surface of water, landforms, weather, and plain still air all generate echoes as well. The receiver must be sophisticated enough to distinguish unwanted environmental echoes from the echoes of interest.
- It's difficult to design directional antennas. There are several approaches that can be taken here, including various forms of dish antennas or phased arrays, but none are perfect and phenomena called "sidelobes" are impossible to avoid. These are flaws in the directivity of the antenna resulting in energy being transmitted or received from directions other than the pointing direction of the antenna which must be compensated for in processing.
None of these challenges are trivial; there are experts who spend their whole lives studying just one of those bullet points. Now that that's out of the way, let's get into how all of this came about.
Developmental History of Radar
The first radar is typically considered to be a 1904 invention by Christian Hülsmeyer called the "Telemobiloscope". The device consisted of a spark-gap transmitter connected to an array of dipole antennas and a receiver using a rotating parabolic antenna. It was used to help ships avoid collisions; it wasn't until 1935 that radar was first used to detect aircraft. It wasn't until 1940 that the vestigially acronymous term "RADAR" was coined and it was around this time that the cavity magnetron was invented, leading to much more capable transmitter technology.[^7] Later in the 1940s and 1950s there was some experimentation with Doppler radar, which brings us to another technical exposition.
It's common for students in early physics classes to learn about the Doppler effect: waves (light or sound) that are emitted or reflected by a rapidly approaching or receding object are perceived as being a higher or lower frequency respectively. The basic physical explanation is that as the range between the source and destination changes, the end of the wave travels a slightly shorter or longer distance than the beginning, compressing or extending the wave in time. You may have learned that this is how things like speed radars work, and hopefully it will come as no surprise that this is another topic which is conceptually simple but practically quite complicated.

Doppler and Apertures
Light moves very fast[^8], meaning that when you're dealing with normal terrestrial speeds the frequency change due to Doppler is extraordinarily small. Because radars often use short pulses it's very difficult (and typically mathematically impossible) to measure the frequency change accurately enough over the duration of a pulse to provide a useful Doppler measurement. Pure speed radars that don't also measure distance typically emit a continuous wave over an extended period of time to reduce this issue, but pulsed radars that measure both range and Doppler have a very challenging design constraint. A shorter pulse provides a more precise range measurement, but resolving Doppler accurately generally requires observing the target over a longer interval. Modern range/Doppler radars work around this issue by processing several consecutive pulses together instead of each pulse individually and inspecting the change in the echo's phase from pulse to pulse. In order to do this, each pulse in the processing interval has to be "cut" from a single, continuous wave and compared back to that wave upon reception of the echo. This is accomplished with a well-tuned oscillator that runs continuously, with its output intermittently routed to the amplifier/transmitter system. The received echo is then compared to that same oscillator. This use of a "Local Oscillator" (LO) is what distinguishes a coherent radar from an incoherent radar, where an incoherent radar does not use an LO to measure the phase of the received echos. It should come as no surprise at this point that the maintenance and integration of such an oscillator is an extremely challenging problem by itself.
Now that we've covered that, we're almost ready to talk about SAR. First we're going to have to talk about apertures. I mentioned earlier that one form of directional antenna is the phased array; I'd like to go into depth on that. In general, antennas can be designed to have a huge range of interesting properties, and there are ways to design antennas that transmit/receive more strongly in one direction than in others. You can also combine multiple antennas to get a similar effect. Imagine a pair of omnidirectional antennas spaced half a wavelength apart along the y-axis. Along the y-axis, their waves cancel because the second antenna is 180 degrees out of phase with the first. Along the x- and z-axes, the waves add because they are in phase. The wave's propagation along any angle between those extremes is degraded but not cancelled completely, where the overall power scales with the cosine of the angle from the normal axis. This fall-off can be made sharper by adding more antenna elements. The more antenna elements, the thinner the beam, but the size of the antenna array increases. This is broadly consistent with any antenna design, where the size of the antenna (the aperture) is related to the width of the beam. For an antenna array configuration, adding more antenna elements increases the aperture and narrows the beam.
[^6]: These are very interesting components. If you have one I'd like to see it please.
[^7]: And also the famously incidental saccharine revelation preceding the invention of the microwave oven in 1945.
[^8]: Citation needed

Keep in mind that each antenna element here is omnidirectional, so it's radiating equally in all directions despite the fact that only one direction is illustrated in each diagram. In reality, most antenna elements aren't fully omnidirectional, they typically have some directivity themselves, which further improves the overall array's directivity.
Synthetic Aperture Radar (SAR)
At this point you can begin to consider an alternative to using a large array of antennas transmitting and receiving simultaneously. You could instead use a smaller array, move it along a flight path, and combine multiple transmissions and receptions in post-processing. This lets you form a narrower beam than the physical aperture of the antenna would normally allow. In order to do this well, you have to make sure that the series of transmissions are all in reference to a consistent oscillator so that you can combine them with the proper phase relationship, so the system necessarily has to be coherent. Of course, this also assumes that there's no motion of the target during the collection period. This is exactly the principle by which Synthetic Aperture Radar works. By coherently combining multiple pulses that were collected by a moving aperture, you can simulate the effect of an absurdly large radar antenna and enjoy the benefits of a minuscule beam as long as what you're observing is stationary. This is why SAR is so commonly used to generate imagery of land.
SAR is now widely used on airplanes and satellites to image the surface of the Earth. By attaching a SAR antenna to the side of such a platform, a high-resolution top-down image of far-away landforms can be produced. Depending on the wavelength of the SAR system, you can extract all kinds of interesting data from these images. In some wavelengths, diseased trees can be distinguished from healthy trees. In others, dry soil can be distinguished from wet soil. Vegetated land can be distinguished from bare land.
Typically, if you want to actually get a numerical result for, say, the moisture content of the soil from a SAR image, you need to have some ground truth collected to calibrate your model. I have a somewhat personal relationship with this particular aspect of SAR since the technology was causally related to the first time[^9] I've ever been apprehended by military police.[^10]

It's nevertheless a useful and ubiquitous technology. SAR can be used to produce top-down imagery of large strips of land without needing to actually fly over the land being imaged. The image is usually generated by flying alongside the area (often at a large distance) of interest with a side-pointing antenna. The imagery also can be taken at night and in poor weather conditions. There are also methods by which multiple SAR images can be compared to detect changes in features much smaller than the resolution of the image. This is called interferometric SAR, and the primary revelation here is that the value corresponding to each "pixel" in a SAR image is actually a complex (in both senses of the word) phase-sensitive combination of the reflections from all features within the pixel. If a sub-pixel feature changes, e.g. because someone walked through the snow and left footprints, it can be detected by comparing the complex pixel value of images before and after the change.
I should note at this point that although I've gone into a fair amount of conceptual depth relating to SAR, this is still just scratching the surface. If you want a more complete understanding it will require getting into depth about Fourier analysis, point-spread functions, image sharpening, foreshortening and layover, and complicated waveform design considerations.
And with that excursion out of the way, we're ready to get back to more conventional imagery.
[^9]: Only time so far
[^10]: You want the story? Fine. I was helping a friend with his project involving using a SAR satellite to assess the ground moisture level in a wooded area. The satellite was scheduled to pass over at night, so we had to go out there and dig some holes to measure moisture so we could use those measurements to calibrate the model his team would be using to digest the satellite's imagery. Of course, digging holes in the middle of the night could look suspicious, so we gave the local police a heads up about what we would be doing. Unfortunately, the area we were digging in was adjacent to a military easement and no one gave the MPs a heads up that we'd be there. They rolled up to the site and kept us occupied for a couple hours before the local police were finally contacted and were able to de-escalate the situation. We didn't end up getting all the measurements we were hoping to that night.
Back to Conventional Imagery
There have been a lot of notable advances in imaging technology since we left off at the end of World War 1.[^11] For starters, as far as imagery is concerned, there's no reason to limit ourselves to just the visible spectrum. If we can come up with chemicals that react to light at specific wavelengths then we can take photographs at those wavelengths. A popular iteration of this during World War II was "Camouflage Recognition" (CR) film, which is sensitive to a near-infrared wavelength in which common green dyes used in camouflage look very different from green vegetation. For a short time, it was useful in aerial reconnaissance because camouflaged encampments, vehicles, and personnel stood out starkly from the surrounding vegetation.[^12] In general, there were a lot of strange variants of film and optical filters created for very specific purposes; it's very similar to the flexibility you get in SAR by selecting an appropriate wavelength for your application. The broad term used to describe this is "multispectral" (using multiple wavelengths) imaging. There's also "hyperspectral" imaging, which seeks to capture many narrow, often contiguous spectral bands. The ideal result would be a full spectral analysis for each image feature.
We also have more sophisticated instrumentation systems integrated onto the photography platforms, enabling much more precise inferences from the resulting photographs. Instead of just looking at two overlapping photographs through a stereoscope, we can analyze the minute differences in their geometry to estimate actual elevation levels and grades. We can precisely register the imagery geographically to monitor things like environmental changes over time or calculate the precise coordinates of a feature on the image. We have photographic lenses and calibration techniques that correct for things like vignetting, which enables measurements of color/intensity on a photograph to be mapped consistently to an actual quantitative assessment. We have higher altitude planes like the SR-71[^13] that can image immense swatches of land with high resolution photography.
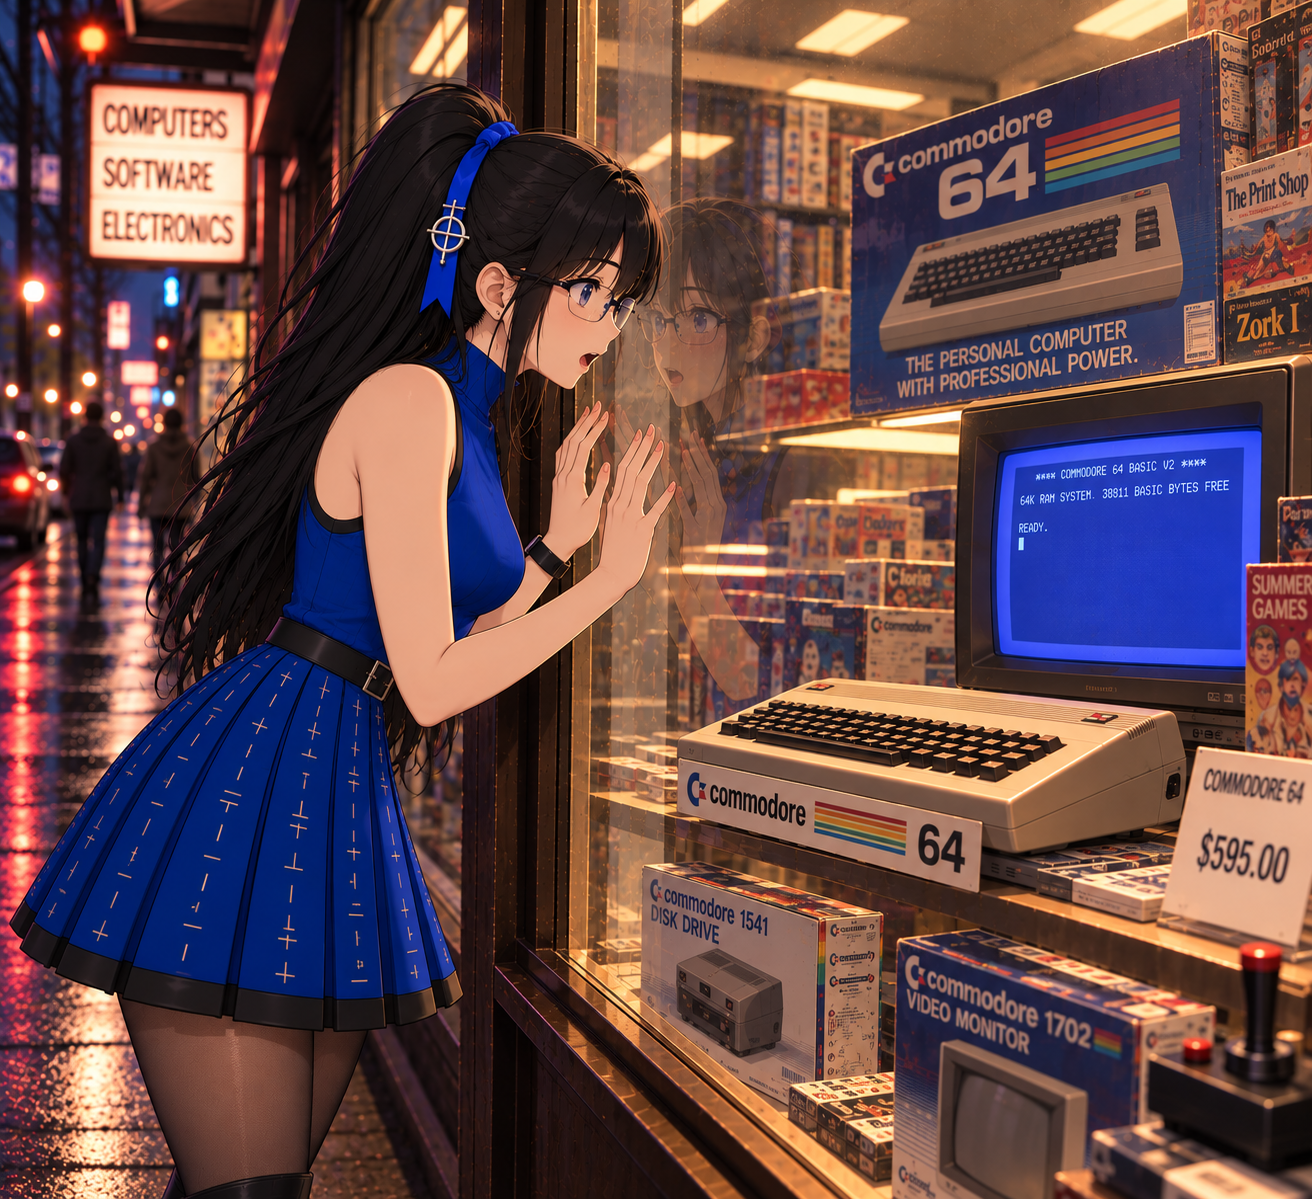
And finally, we have the digital revolution.
[^11]: Citation nee- oh, wait, I already used that joke
[^12]: It wasn't long before dyes were developed that didn't have this issue, but you can still use this film for all kinds of fun like distinguishing astroturf from real grass.
[^13]: The airplane, not the band
Digital Imagery
What are digital images
Computers typically store and process data in binary. There's nothing very complicated about binary, which is exactly what makes it so useful. Any non-negative integer can be represented as a sequence of numerals between 0 and 1, just as we represent integers with numerals between 0 and 9 in our familiar decimal system. You can extend this representation to encompass negative integers, fractions, and non-integers through a number of clever abstractions like two's complement, rationals, and fixed- and floating-point representations. Weirdly enough, although those representations are critically important in computer science, they aren't all that necessary to understand most forms of digital imagery. As for binary itself, dealing with just 0s and 1s is nice because you can represent a 0-or-1 (this is called a bit by the way) in a wide variety of ways: whether a light is on, whether a switch is flipped, whether a voltage level is above or below some threshold, whether a signal is at one frequency or another frequency, whether or not a hole is punched in a card, etc. So, binary is a fairly straightforward way to represent numbers in a machine.
One complexity that arises here is that we can store data as a long sequence of bits, but we don't have any kind of punctuation or delimiters to say "this is where one number stops and the next one starts". In order to work around this, we need to make sure that whatever is generating the data is using the same data format expected by whatever is digesting the data. Because a single bit doesn't have a lot of useful information, we usually like to break binary data into 8-bit sections called bytes. Each byte, being 8 bits, can represent any integer between 0 and 255 (255 is 2 to the power of 8 minus 1. It's analogous to how the largest number you can represent in 8 decimal numerals is 99999999, or 10 to the power of 8 minus 1).[^14] We can still represent numbers larger than 255; we just need more than one byte. It's common to use anywhere from 1 byte to 8 bytes depending on the scale of the number, and in unusual cases we can go much higher than that. Keep in mind that the maximum representable number increases exponentially with the number of bits, so an 8 byte number can be extremely large.
Breaking things into bytes doesn't really resolve the format issue though since each individual piece of data could be any number of bytes long, so if you don't know how to read the binary that someone else wrote then it's not very useful. If you want to store a grayscale image in binary you could define a format like: "My image will be 100 pixels by 100 pixels. Each pixel's grayscale intensity will range from 0 (black) to 255 (white) and the intensity of each pixel will be represented by one byte. The format consists of 100 sections of 100 bytes each. Each section contains the intensity of one row of 100 pixels in order from left to right. The sections are in order from top to bottom." That's a perfectly usable format, and if you programmed one computer to produce image data in that format and another computer to display it in that format it would work. If you wanted to make it more flexible, you could use the first two bytes in the data to encode the width and height of the image instead of having it fixed at 100 by 100. You could use another byte to encode the number of bits per pixel if you wanted to be able to accommodate higher intensity resolution. You could repeat that three times to encode red, green, and blue[^15] intensity to have a color image. You're now getting quite close to actual image file formats like .bmp or .png, with just one detail missing. For large images, this ends up being a lot of data. And in a lot of images a large portion of it is either repetitive (e.g. large areas of constant/near-constant color) or predictable (e.g. consistent gradients). There are algorithms (outside the scope of this article) that leverage those kinds of features to encode the image in a smaller, compressed, format. It's not important to understand those right now but if you're interested it does touch on work done by my namesake, Claude Shannon.
Now that we know what a digital image looks like, we can investigate how they get produced.
[^14]: Bytes are also nice because 0-255 provides a comfortable range of values to map to text/punctuation characters. That's basically what ASCII is, although traditional ASCII actually only needs the first half of that range.
[^15]: I could have gone harder into color theory for this article but I actually find it really interesting so it wouldn't have worked out.
Digital Cameras
Digital cameras aren't all that different from chemical cameras from a layout standpoint; they still have a lens which directs incident light onto an imaging plane which is reactive to the light. For chemical photography, the imaging plane has chemical properties that allow it to retain artifacts from the light exposure. In digital imagery, the imaging plane is an array of photosensitive electrical components whose response to the light can be measured by computing hardware. There are a couple of common forms of this imaging plane: the Charge-Coupled Device (CCD) and the Active-Pixel Sensor (APS).
A CCD is essentially a 2-dimensional array of photosensitive capacitors[^16] configured so that the electrical charge from each row can be transferred to the neighboring row by the camera's control electronics. During exposure, the array is exposed to the projected image which causes the capacitors in bright areas to accumulate charge. Once the exposure period is over, the charge from the first row of capacitors is read into digital storage by a series of Analog-to-Digital Converters (ADCs)[^17]. After the read is complete, the CCD is commanded to transfer the charge from each row over to the next row and the read process repeats, now reading the second row of charge values. This process repeats for each row until the full image is read.
An APS is a 2-dimensional array of photosensitive diodes[^18] and transistors[^19] that represents the state of each photosensitive diode as an amplified voltage level. Every element in a row is connected to a signal wire for that row which enables the camera's control electronics to turn the elements on or off on a row-by-row basis. Every element in a column is similarly connected to a signal wire for that column, but the column-by-column signal wire is used for the element's output voltage to be read by an ADC for that column. By consecutively switching rows on and back off one at a time, the column voltages can be read repeatedly to read and store each row of the full image.
Of course, all of this complexity only gets us to grayscale imagery since each pixel sensor is producing just one number corresponding to the overall intensity of the projected light. In order to get full color imagery, we need three different numbers for each pixel corresponding to three different colors, typically red (R), green (G), and blue (B). Unfortunately we can't really overlay three separate imaging planes since they would block each other's light. Instead, we allocate adjacent pixels into individual R, G, or B measurements. We do this with specialized Color Filter Arrays (CFAs), which are grids of alternating R, G and B filters that mask each pixel with the desired filter. Note that when I say "alternating", I don't actually mean repeating "R, G, B, R, G, B, ...". In general, laying out a combination of three different colors strategically on a 2-dimensional array is an interesting problem. The most common solution to this is called a "Bayer array", which allocates a full half of the pixels to "G" in a checkerboard pattern, while "R" and "B" are used to fill out the remaining pixels, alternating row-by-row. The reason that green is given such a large portion of the grid is because the human eye is actually much more sensitive to the color green than to red or blue.
Of course there's another problem here, which is that most digital color image formats require individual R, G, and B channels for each pixel, but we have alternating single-channel pixels. There's a whole field of study for this problem of deriving a full three-channel image from a CFA called demosaicing. A lot of camera manufacturers have proprietary algorithms for doing this, and it also has applications in digital image forensics. Demosaicing algorithms can leave traces in the final image, and if you know what to look for, those traces can sometimes be used to identify the camera that produced the image or detect digital alterations. The important thing to know right now is that it's an interesting problem with a lot of strange solutions. It's also the last step in generating digital imagery so we're ready to get on to the next section.
[^16]: A capacitor is a simple electrical component which is able to accumulate and store electrical charge for a short period of time.
[^17]: ADCs are complex components that can measure a voltage level and produce a corresponding digital binary value. Their operation won't be discussed here.
[^18]: A diode is a simple electrical component that resists electrical current flow in one direction. Photosensitive diodes react to incoming light by actually producing a small electrical current, which is related to how solar cells produce energy.
[^19]: Wow, so many electrical components to cover. A transistor is a simple 3-connection component that can be configured to respond to extremely small changes in input voltage with large swings in electrical conductivity across its other two connections. They're commonly used to amplify weak signals, which is why they appear in things like transistor radios.
Remote Sensing in the Modern Era
Even though it might seem like digital imagery is a stand-in replacement for chemical photography, it actually buys us a lot of interesting advancements in remote sensing. For one, computers are very good at performing, well, computations on the data that's available to them. Where we used to be able to look at overlapping aerial photographs with complex optical equipment to approximate elevation/grade of specific features in the overlapping area, we can apply computerized processing to those images and get a precise numerical elevation map for the entire area. We can numerically register imagery taken from different vantages at different times and produce a pixel-by-pixel comparison of the images to detect changes. We can cross-reference elevation maps to SAR or optical imagery to correct for distortions caused by foreshortening and layover. We can store immense databases of imagery in a way that can quickly be referenced by location, date, and contents. We can also transfer digital images over radio rather than needing to physically transport them, which makes satellite imagery a lot more practical.
Unsurprisingly, these realizations quickly motivated people to begin the process of amassing enormous amounts of digital imagery data. The SIR-C/X-SAR experiments flew aboard the Space Shuttle Endeavour twice in 1994, collecting data at L-, C-, and X-band wavelengths, and the Shuttle Radar Topography Mission in 2000 used modified versions of the same radar systems to produce a near-global elevation dataset. Imaging satellite constellations like Landsat, MODIS, and ASTER were launched providing global satellite imagery while thousands of low- and high-altitude aircraft were outfitted with digital image collection hardware to supply close-in imagery.
Imagery databases became widely available to the public. Google launched "Google Earth" in 2005, making it one of the first widely available consumer global imagery databases. It enabled users to easily inspect imagery of any region on Earth and cross-reference low-, medium-, and high-altitude aerial imagery with satellite imagery. Global databases like this were digested by increasingly sophisticated computer algorithms, enabling the automatic identification of roadways, residential addresses, rivers, and coastlines. In the modern era, advanced machine-learning models are deployed on global imagery to categorize natural disasters, assess environmental status, identify military targets, and analyze human behavioral patterns. Imagery databases such as these have been used to monitor supermarket parking lots to estimate retail activity and predict earnings for investment purposes, analyze coastal features to identify profitable resort locations,[^20] and monitor global shipping patterns to predict recessions.
I hate to end the article here, but we've circled back to everything I teased in the introduction and have strategically bypassed about fifty articles worth of secondary rabbit holes. I've dropped enough terminology to get you started if you're interested in diving into any of that; I wish you well on your endeavor.
[^20]: Cancún's location was selected using a computer model run on an IBM System/360 in the late 1960s. No, that's not a joke.
Kind Regards,
Shannon
If you're still interested in more, check out the talk page!